|
Prosticks Articles
蘋果日報 --- 七月十六日
聚焦點可防假突破
較早前介紹過如何利用聚焦點畫出支持及阻力趨勢線,取代傳統的高低位畫法;也介紹過用聚焦點畫出的趨勢線,比用傳統的高低位畫法,能更早把握出入市時機,今天進一步解釋如何利用聚焦點預防假突破。
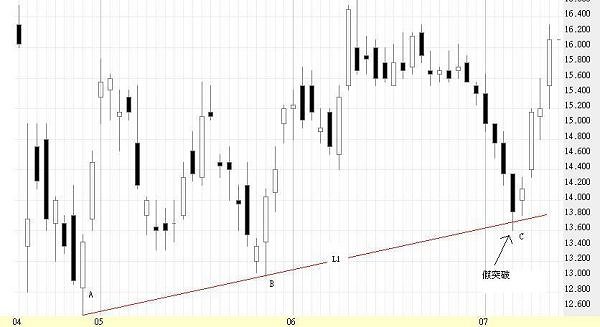
下圖是盈科數碼動力(1186)的陰陽燭圖,L1是用
A至B的低位畫出的支持線,由圖可見,價位在C假跌破此支持線,發出走勢繼續向淡的訊號,然而在跌破之後,隨後幾日股價卻急升。股價在
C處跌破L1,明顯為一走勢陷阱,以為破位而沽貨者,無疑要蒙受很大損失。
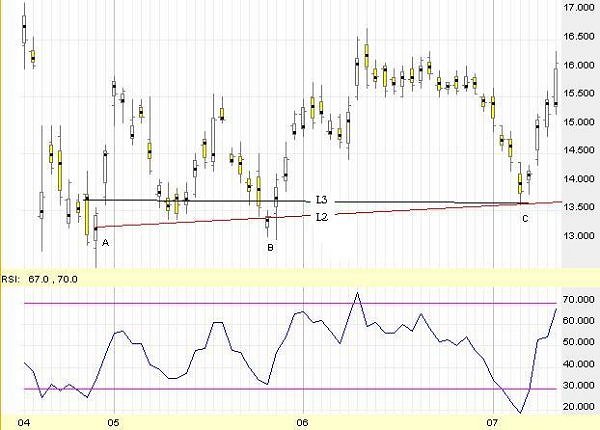
上圖是盈動的乾坤燭圖,L2是用A至B的聚焦點畫出的支持線,明顯看到,
C的低位很準確地落在L2上,即是說,當傳統的趨勢線因假跌破而發出錯誤訊息時,聚焦趨勢線卻保持正常。因此,投資者若只看陰陽燭圖,畫出趨勢線L
1,很可能墮入走勢陷阱。但如果他同時查看乾坤燭圖,會發現聚焦趨勢線L
2略低過L1,應等L2被跌破才沽,尤其是L2同L1相當接近,當價位在C
處勢力嘗試跌破L2而不果,應當小心。
傳統趨勢線多陷阱
究竟有沒有方法預測到C是底部呢?看看下面的原因:
- 在C處,股價只短暫接近L2,且很果斷地收於其上
- C的低位落在之前的聚焦點平台L3上,L3有4個聚焦點,有可靠支持。於是,C處其實有雙重支持:聚焦趨勢線L
2和聚焦點平台L3。
- RSI (如圖) 及STC嚴重超賣。
正如上周本欄所述,當弱勢的下跌動力遇上強固的支持位時,反彈可期。傳統的趨勢線,由於多年來已經街談巷議,所有人畫出來都是同一條,很容易成為大戶的目標。大戶可能等阻力線被升破才開始散貨,或者等支持線被跌破才開始收貨,因此可以借用乾坤燭避開假突破。
|