|
Prosticks Articles
蘋果日報 --- 7月30日
逢低買入有圖可循
「逢低買入」是股票市場中廣泛應用的策略,特別是在上升趨勢確認之後,
在每次調整接近尾聲時買入。可是知易行難─
- 如何辦別只是暫時調整,而不是轉向,開始跌市?
- 調整的低位何在?
盈科數碼動力(1186)
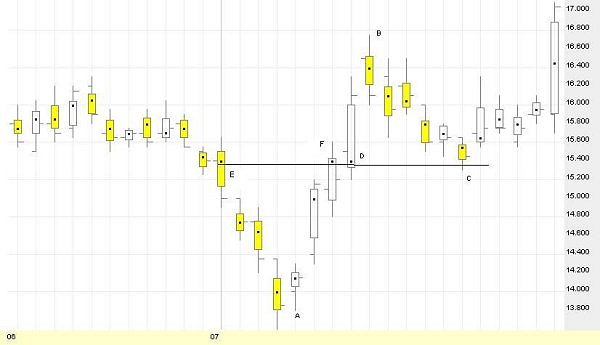
上圖是盈科數碼動力(1186)乾坤燭圖,從A到B的強力反彈,確認了上升趨勢,想逢低買入的投資者,應等候股價調整時在低位買入。從B到C,盈動股價下跌,但何以得知這是調整而非開始下跌趨勢?請看從B至C,股價連跌6天,都跌不過D的低位,同之前的反彈力度相比,很明顯這次下跌缺乏動力,只屬調整。平均上,從B至C的活躍區,比從A至B更短。
那麼,何以得知調整止於C?由於從B至C,6支燭都在一支D燭之上,很自然地,位於底部的D燭聚焦點,應該對股價有一定的支持作用。一般調整通常持續3至6日,在C點,已是第6日,股價來到D的聚焦點附近,調整似乎接近尾聲。而且,D的聚焦點同E、F的聚焦點在同一價位,形成聚焦點平台,提供很強的支持。
結合其他工具更準確
一個聚焦點平台,若包含幾個聚焦點,代表市場在此價位有積聚的購買力,當股價落到此價位時,這些購買力會重現,上升趨勢中每次調整的最低位常會出現在重要聚焦點或聚焦點平台。
下圖是恒生銀行(011)的乾坤燭圖,在升浪中,每次調整總是來到之前的重要聚焦點,就會止步。當然,每支燭都有一個聚焦點,哪些可以用來預測調整低位呢?
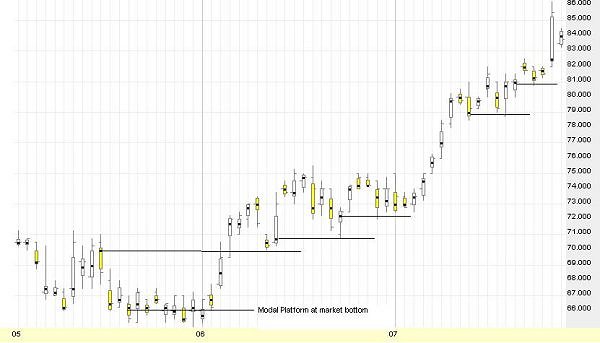
恒生銀行(011)
聚焦點的過濾是一種藝術,除了其他的傳統技術工具以外,還取決於對過去形態的鑑賞力、觀察力。應用巳過濾的聚焦點,再結合RSI、STC等工具,可以更好地預測調整低位。對於聚焦點的過濾,我們已研究出一些有效的技巧,有興趣的投資者,可到我們的網頁參觀。
(有關乾坤燭之連載可於乾坤燭網站 www.prosticks.com 內觀看)
|