|
Prosticks Articles
蘋果日報 --- 九月二十四日
P-RSI測背馳更準確
RSI(相對強弱指數)是一個被廣泛應用的技術分析指標,主要用來測量最近一段時間內升對跌的強弱勢,幫助了解買賣雙方何者佔優勢,RSI亦可用來判斷價位是否已超買或超賣,是否出現轉向。
RSI的刻度是從0至100,RSI位於50以上,代表買方佔優勢;位於50以下,代表賣方佔優勢。高過70表示超買,低於30表示超賣。
RSI的其中一個用法是進入超買時沽出,進入超賣時買入,但這樣做比較危險,特別是在趨勢市,RSI可以停留在超買區很久而不出現調整。
RSI的另一個用法是背馳,假定市場充斥正面消息,價位每天創新高,但RSI卻出現下跌的徵兆,此謂背馳。這時我們必須小心,因為市場購買力量開始疲憊。類似的背馳也會發生在超賣情況下,當價位不斷創新低時,若發現RSI背馳,說明市場已經開始慢慢變強。
較傳統RSI可靠
在最初的公式中, RSI以收市價來計算,現在有了乾坤燭,我們可以用聚焦點來計算RSI,稱為P-RSI
(即Prosticks-RSI)。用聚焦點來計算RSI,同用收市價來計
算是不同的,因為有時即使收市價升,但聚焦點可能會跌,因此,不同的計算法會產生不同的結果。
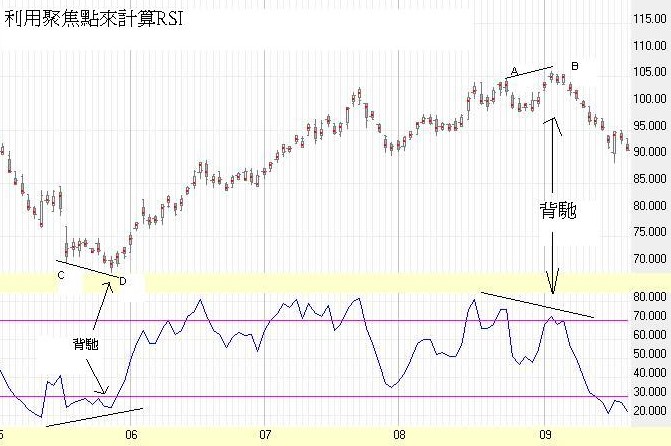
長江實業(001)
上圖是長實 (001)的乾坤燭及P-RSI圖,在B處,價位升高過先前的高位A,然
而P-RSI卻開始下跌,這是背馳現象,結果股價在隨後的一周內下跌超過10%
。此外,在D處,股價同之前低位C比較,是創了新低,但P-RSI卻反而開始
回升,這也是背馳,強力的升勢從D開始展開。
下圖是長實 (001)的乾坤燭及傳統RSI圖,在B和D處,RSI並未出現背馳,原因很簡易,收市價只是一個價位,而聚焦點來源於整天的交易,更值得信任。
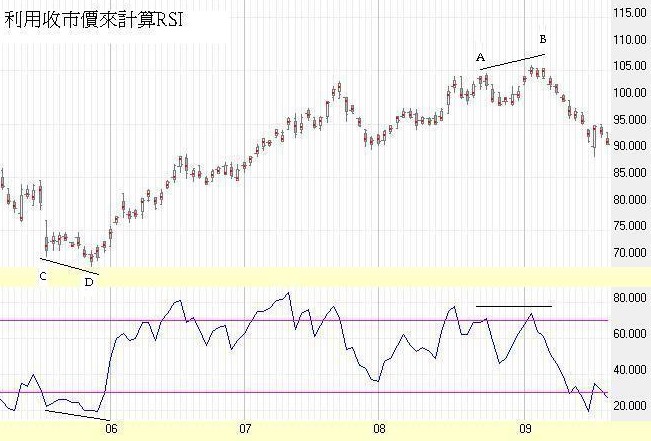
長江實業(001)
|