|
Prosticks Articles
蘋果日報 --- 十月一日
開市價意義重大
很多投資者不重視開市價,只會注意收市價及全日高低位,其實開市價是很重要的。之前已經討論過,活躍區是市場的價值範圍,代表買賣雙方一致認同的價格區域,當收市位低於活躍區,可以說淡友得勝,理論上市場在第二天的開市位也應該低於活躍區。可是,如果第二天的開市位出乎意料地是在活躍區之上,說明可能有些公眾尚未知道的重要事情已經發生。
下圖為恒生指數的乾坤燭圖,在A日,裂口低開且收市接近全日低位,再加上收市價低於聚焦點及活躍區,極其利淡。想不到翌日 (B)開市位卻是在A的活躍區之上!留意A之前10日,每支陰燭的翌日,開市價從不會在活躍區之上!
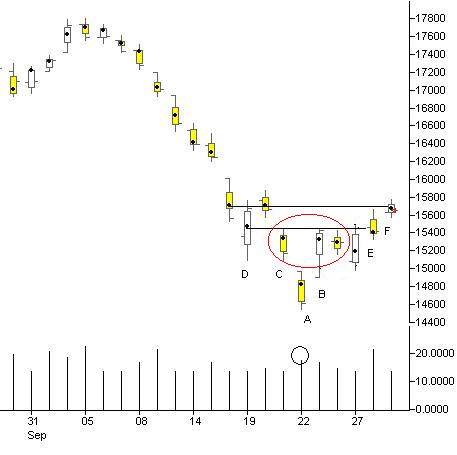
恒生指數(日線圖)
因此,B日的開市價在A日活躍區之上預兆某些事已經發生,在B日,恒指大幅反彈逾 800點!留意A的聚焦量,雖然A是大陰燭,但聚焦量相對較高,高於之前的日子及150天平均數,代表買賣雙方曾經在聚焦點價位激烈交戰,儘管當日沽家佔了上風,但購買力量已開始進入市場。
以聚焦點計P-STC
留意圓圈內的三支燭,聚焦點在同一價位,高位均受制於D的聚焦點,而燭A與燭B、C形成裂口,類似陰陽燭的早晨之星,但如果看陰陽燭圖(此處未列出),A、B、C並不構成早晨之星形態。
東寧高科技(606)
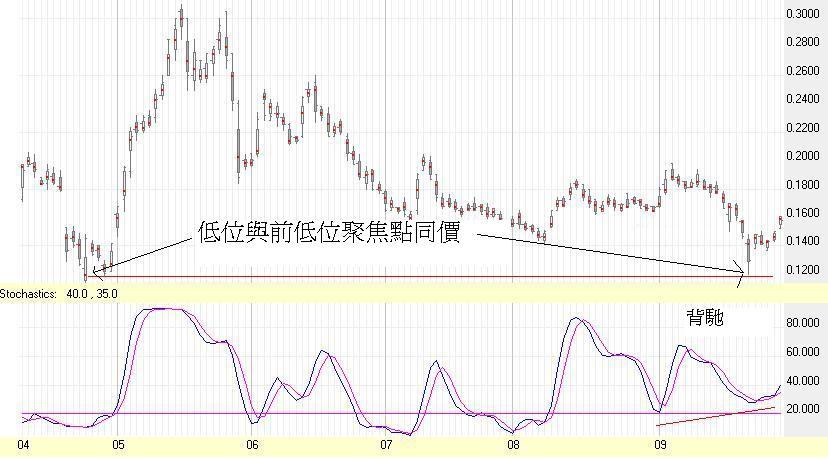
上一期介紹過 P-RSI,它同RSI的計算公式一樣,不過是用聚焦點來代替收市價
;同樣地,我們也可以用聚焦點代替收市價計算STC,稱為P-STC。上圖是東
寧高科技(606)的乾坤燭及P-STC圖,在連續下跌之後於0.12元找到支持(A),A
的低位與B的聚焦點相同,其聚焦點應是一個重要支持。另一方面,在A日,P-STC明顯背馳,是利好訊號,若是應用傳統的STC(此處未列出),不會發現
背馳現象。
|