Nov 3, 2025  1:59:09 PM HKT

TourSiteMapFAQsAboutContact
Home QR  Forex TV 
UsernamePassword
SavePW
sp

  Home > Education > Articlespatentsp
  
sp
sp
sp
articles
 

Prosticks Articles

Apple Daily --- Oct 22, 2000

Understanding Prosticks from a Price-Time Distribution Diagram

The Prosticks theory is originated from a price-time or price-volume distribution diagram. The approach is borrowed from Market Profileâ invented by Pete Steidlymayer in the 1980s.

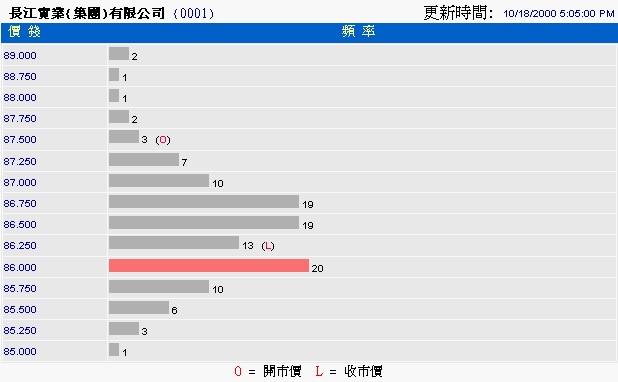
Figure 1 shows the price-time distribution profile of Cheung Kong (0001) on 18th of October. The profile is constructed in this way. The whole day is divided into 5 minutes intervals: 10:00-10:05, 10:05-10:10, 10:10-10:15, and so on. Suppose during the interval 10:00-10:05, the stock has traded at 87-87.5, we will mark a on 87, 87.25 and 87.5. Then in the interval 10:05-10:10, the stock trades in the 87.5-88 range, we will then mark a "X" on 87.5, 87.75, and 88.0. Notice that we only count once at each five minute interval. For example, if the stock has traded at 87 three times during 10:00-10:05, we will only mark one "X"  in 87 instead of three. Hence, we can interpret the number of "X" owned by a price as the number of five minutes the market has spent trading at that price.

Refer to Figure 1 again. As we can see, the price $86 has 20 "X".  That means throughout the whole day, the market spends the most five minutes interval trading at that price. That is our Modal Point. The Modal Count is 20. Notice that most "X" occurred at price around 85.75-87 and that is our Active Range. The exact boundaries of the Active Range is calculated using statistical formulae applied to the distribution. The official Prosticks website contains the exact formula of the Active Range.

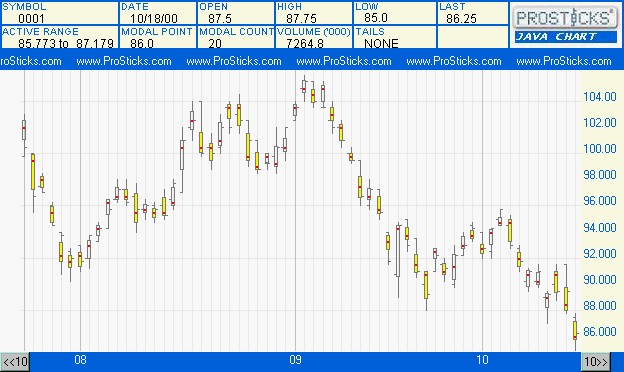
After the Modal Point and Active Range are derived from the distribution diagram, they are then overlaid in the traditional Bar chart, forming the Prosticks. Figure 2 shows the Prosticks chart of Cheung Kong.

As readers should recall, there are two approaches in computing the Modal Point: by time and by volume. The distribution from Figure 1 is the time approach. To compute Modal Point and Active Range using the volume approach, we should use a price-volume distribution. The price-volume distribution, though not shown here, has the same layout as the price-time distribution. However, each "X" corresponds to the volume traded at that price instead of the number of five minutes the market has traded there.

The raw distribution diagram offers several interesting insights. Refer to Figure 1 again. From it, we know that the Modal Point is at 86 since it contains the most "X". However, notice that the two prices 86.5 and 86.75 also contain a lot of "X". Thus, they are also significant price levels. Besides, notice that the price range at 88-89 has only 1-2 "X" for each price. They signify that the selling pressure is very severe there.

The shape of the distribution profile is similar to a bell curve. Volume in the middle are dense while that in the high and low ends are sparse. Under normal circumstances, price movements of most stocks assume this bell-shape.

The official Prosticks website enables one to retrieve the distribution diagram of HK stocks, currencies, and indices for free. In the menu bar, select tools and then click Distribution? Type in the stock code and the distribution will be generated. The distribution diagram is delayed by one hour.

Observing real-time distribution diagram is interesting. One can monitor how the bell and the Modal Point are evolved over time. One can also use the distribution to assist day trading. For example, suppose after the market closes in the morning session, we observe that the distribution of a stock is already a very nice bell-shape. Other things being equal, we may then speculate that the market in the afternoon will also trades around the thick portion of the bell. We should then buy when the market is near the low end of the bell and sell when the market is near the high end of the bell, capturing small but nice intraday profits.


sp
agreementspprivacysppatent
sp
sp
sp
sp

Copyright© 2025 ProSticks.com Limited. All rights reserved. ProSticks.com Limited, Hong Kong Exchanges and Clearing, HSI Services Limited, endeavor to ensure the accuracy and reliability of the information provided but do not guarantee its accuracy or reliability and accept no liability (whether in tort of contract or otherwise) for any loss or damage arising from any inaccuracies or omission. Currently, all Hong Kong stock and index quotes are at least 15 minutes delayed. Currency and commodity quotes are all 10 minutes delayed. All others are updated irregularly.