|
Prosticks Articles
信報 --- 七月二十四日
分辨乾坤燭有用聚焦點
讀者應已了解聚焦點能提供支持位和阻力位的重要資料。然而,每支燭都有一個聚焦點,如何知道哪一個有效用,哪一個是噪音?
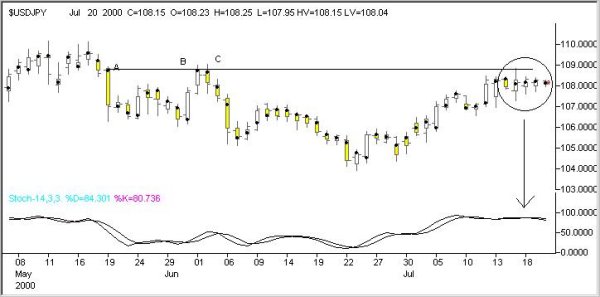
美元在6月24日造出104日圓低位後,價位止跌回穩,在108形成密集區(圖)。由A、B、C的聚焦點形成的聚焦點平台,與該密集區的高位一致,顯示聚焦點平台對價位的強阻力作用。問題是,如何能預知A、B、C的聚焦點重要及其聚焦點平台的功效?
一、燭A是一支長身燭,當天價格跌得很恐怖,表示市場存在很大的沽售壓力,尤其是在聚焦點價位,淡友控制了大局。於是,當價位再次升到接近該聚焦點價位時,首先沽售壓力再次湧現,其次,在A買入的弱者爭著鬆綁,增加沽售壓力。A的聚焦點很重要。
二、燭B及C形成雙頂,表現來自大戶的沽售壓力,其聚焦點在同一價位,說明這些大戶在此價位投入金錢。B及C的聚焦點重要。
基於上述原因,得出結論,A、B、C形成的聚焦點平台,的確是一個強阻力位。然而,即使再強的阻力也會被沖破,否則便只有上落市,沒有單邊市了。那麼,怎樣知道價位是將停留在平台還是將被沖破呢?
要回答此疑問,需要借助技術分析工具。圖下方是日圓的STC,當價位走近平台時,STC在超賣區,因此,在這次的進攻中,市場可能缺乏破位動力。
或許價位最終能成功攻破此阻力平台,但除非升破當天,連其活躍區也站穩在平台上方,否則美元升勢仍將受阻。
(有關乾坤燭的連載可在乾坤燭網站 www.prosticks.com 內觀看)
|