|
Prosticks Articles
經 濟 日 報 6 月 16 日
以乾坤燭避走勢陷阱
在 圖 表 分 析 學 裏,辨 認 價 格 形 態 (Patterns)
以 確 定 價 位 趨 勢 極 其 普 遍。傳 統 陰 陽 燭 圖 的
「烏 雲 蓋 頂」 是 一 個 重 要 的 空 頭 反 轉 形 態
(Reversal pattern) 訊 號。即 當 此 形 態 出 現 時,價 位
會 轉 勢 下 跌。烏 雲 蓋 頂 的 出 現 是 當 價 位 一
直 在 上 升 趨 勢 中,某 一 天 開 市 突 然 裂 口 高
開,但 隨 即 下 跌,且 收 於 低 位,成 為 一 個 長
條 黑 實 体,理 論 上 價 位 可 能 已 到 頂 而 很 快
會 回 落。
長實烏雲蓋頂訊號失敗

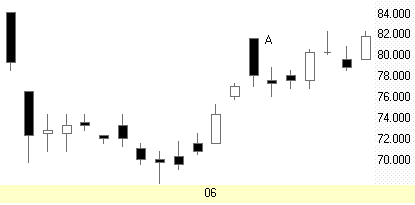
圖 1 是 長 江 實 業 (0001) 陰 陽 燭 圖,根 據 理 論,燭 身
A 是 烏 雲 蓋 頂 形 態,意 即 價 位 己 到 頂,而 後 市 走 勢
會 反 轉 偏 淡。但 結 果 剛 相 反,長 江 股 價 隨 後 數 日 只
是 橫 行,而 沒 有 下 跌。

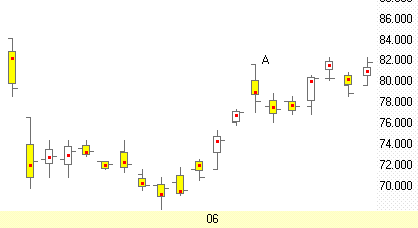
圖 2 是 長 江 實 業 之 乾 坤 燭 圖,留 意 燭
A 的 形 態 跟 陰 陽 燭 的 明 顯
有 所 不 同,原 因 是 乾 坤 燭 實 体 是 代 表 成 交
量 活 躍 區,而 不 是 由 開 市 及 收 市 價 組 成。由
於 乾 坤 燭 圖 之 燭 A 不 能 被 看 成 是 烏 雲 蓋 頂
形 態,所 以 走 勢 不 應 看 得 太 淡。
還 有 乾 坤 燭 之 燭 身 A ,聚 焦 點 及 活 躍 區 都
還 是 在 上 升 中;而 且 由 活 躍 區 組 成 之 實 体
甚 短 小,顯 示 當 天 沽 售 力 量 只 集 中 在 某 一
狹 窄 範 圍,而 非 全 面 性 的。所 以 當 天 的 下 跌
極 可 能 只 是 在 收 市 前,市 場 的 過 度 反 應,投
資 者 不 應 在 此 位 沽 貨。
兩 種 圖 表 分 析 比 較,乾 坤 燭 在 此 情 況 下 避
免 了 傳 統 陰 陽 燭 的 圖 表 陷 阱。
附成交量測市較準確
陰 陽 燭 的 價 格 形 態 時 常 會 出 現 「圖 表 陷
阱」。主 要 是 因 為 每 枝 陰 陽 燭 都 是 由
開、收、高 及 低 四 個 價 位 形 成,這 些 個 別 價
位 很 多 時 侯 會 受 人 為 因 素 或 市 場 過 度 反 應
而 變 成 不 甚 可 靠。相 反,乾 坤 燭 之 聚 焦 點 及
活 躍 區 因 涉 及 強 大 成 交 量 之真 正 數 據,極 難
受 人 為 因 素 操 縱,故 能 反 映 市 場 內 部 真 實
交 易 力 量,以 此 作 分 析,準 確 度 高。
(前 篇 乾 坤 燭 簡 介 可 從 乾 坤 燭 網 站
www.prosticks.com
常 見 問 題 頁 內 觀 看。)
| 

