|
ProSticks - Learning Curve
Hong Kong Economic Time --- June 20, 2000
The Relationship between Modal Point and the Time
Element in ProSticks Charting
Time is a very important element when analyzing markets. Either
consciously or subconsciously, investors will incorporate the
concept of time when making trading decisions. For example, if the
market spends too much time trading at a price level, most investors
will agree that something is going to happen and a market explosion
on either side is imminent. By the same token, if the market spends
too much time attempting to break a resistance or support level but
fails, most will agree that the resistance or support level is
likely to hold.
Thus, the amount of time the market spends on various price
levels can offer critical insights into market behaviour. Compared to
the volume factor, the time element is of no less importance. To illustrate,
let us examine an investor's psychology. An investor often base
his or her trading decisions on the tick-by-tick movement of a stock.
When a price tick has appeared many times throughout the day,
either consciously or subconsciously, an investor will deem that that
price is important. The actual tick volume traded at that price is often
neglected. In short, while most investors will
appreciate the importance of volume, when they monitor the markets on a
tick-by-tick basis, they are inclined to place more emphasis on
the frequency of ticks, rather than their volume. In the end, this
aspect of human psychology causes the time factor to have a greater
effect on price movements than the volume factor since markets
usually move in a self-fulfilling fashion.
Actually, volume data can be misleading. For example, if a stock
has a public or rights offering issued in the afternoon, the volume
data for the afternoon prices will become exaggerated. Besides, special
transactions such as pre-open orders, market orders, and special lots
tend to distort volume information and render it less effective.
Nevertheless, volume and time are highly correlated. In a highly
liquid market such as currencies, index futures, and blue chips, it
is a safe assumption to say that the more time the market spends at a
price, the more volume there will be for that price.
As such, there can be two approaches in estimating the Modal Point,
namely the Time and Volume approach. In the volume approach, the
Modal Point is simply the price with the heaviest volume. Whereas in the
time approach, the Modal Point is the price that the market spends the
most time on. Under normal circumstances, the Modal Point calculated
from the two approaches are highly correlated. Our research suggests
that Modal Points calculated from the time approach are more significant when
forecasting future support and resistance levels.
How can we quantify the amount of time the market spends on a
price? One way is to divide a trading session into a smaller unit: 5 minutes.
Then, we observe the number of 5 minute intervals the
market has traded at a particular price. For example, suppose the market has
traded at $100 during 10:00-10:05, 11:15-11:20, and 14:50-14:55. The amount of time
the market has traded at $100 is therefore 3 units. The price with the greatest
number of time units is the ProSticks-By-Time Modal Point, and we define the
corresponding number of time units traded as the Modal Count.
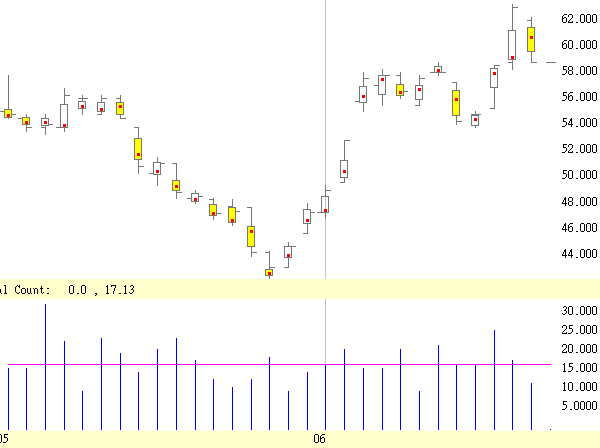
The below chart shows the ProSticks chart for SHK Properties (016) and
its associated Daily Modal Counts. The horizontal line is the 150-Day Modal
Count average.

|