Nov 3, 2025  2:05:05 PM HKT

TourSiteMapFAQsAboutContact
Home QR  Forex TV 
UsernamePassword
SavePW
sp

  Home > Education > Articlespatentsp
  
sp
sp
sp
articles
 

ProSticks - Learning Curve

Hong Kong Economic Time --- June 21, 2000

Using Modal Count to Detect Consolidation Breakout

In the previous article, we briefly explained the concept of time and Modal Count. To recall, the Modal Count is the number of discrete 5-minute intervals the market has spent trading at the Modal Point. For example, if the market has traded at the Modal Point of $100 at 10:20-10:25, 11:00-11:05, and 12:05-12:10, the ProSticks-By-Time Modal Count of $100 is 3.

ProSticks.com continuously updates the Modal Points Counts of Hong Kong equities and indices throughout the day. Thus, investors do not have to wait for the market to close to find out the Modal Point and Modal Count of their favourite stocks. Due to SEHK regulations, stock quotes and ProSticks charts are currently one hour delayed.

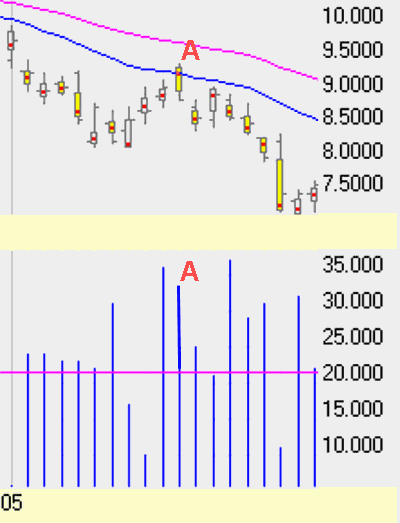
The chart below shows the ProSticks chart of Legend Holdings (0992) with the Modal Count plotted below. Notice that the Modal Count plot is similar to the volume plot found in traditional charts. The horizontal line in the Modal Count plot is the 150-day average of the Modal Count. As can be seen in the chart, the Modal Count average is 23.73. In other words, the market, on average, spends roughly 23.73 5-minute intervals trading at the Modal Point.

The most important application of the Modal Count is the ability to anticipate consolidation breakouts. For example, suppose that we know that the 150-average of Modal Count is 23.73. On a particular day, we observe that the Modal Count has reached 24 already and the Modal Point is $100. Even though the market has not closed, we can speculate that the market has already spent more than a fair portion of the time at $100. Two things may then occur : (1) for the remainder of the day, the market will continue to consolidate around $100. In this case, we can then adopt a "buy low, sell high" strategy, using $100 as the center point or; (2) an explosive breakout on either side is imminent. In this case, we have to monitor the market closely and anticipate the eruption.

Refer to the chart once again. On 6/16 (marked A), the market gapped up near the 20-day Simple Moving Average, a sign of bullishness. However, the market failed to trade above the average and spent the majority of the time trading at the Moving Average price of $9.3. The Modal Point for that day was in fact 9.3. The corresponding Modal Count was 33, higher than the 150-day average of 23.73. Therefore, in the middle of that day, when the market was still consolidating at $9.3, and we observe that the Modal Count was already at 33, we can assume that the consolidation is nearly over and a breakout is forthcoming. The market has spent too much time trying to breach the moving average resistance but failed. Thus, the breakout should be on the downside.

As can be seen from the chart, the price later tumbled on the downside and for the few days afterwards, the downtrend continued.

The Modal Count is a difficult concept to grasp but it is a very powerful tool, especially for day-traders.


sp
agreementspprivacysppatent
sp
sp
sp
sp

Copyright© 2025 ProSticks.com Limited. All rights reserved. ProSticks.com Limited, Hong Kong Exchanges and Clearing, HSI Services Limited, endeavor to ensure the accuracy and reliability of the information provided but do not guarantee its accuracy or reliability and accept no liability (whether in tort of contract or otherwise) for any loss or damage arising from any inaccuracies or omission. Currently, all Hong Kong stock and index quotes are at least 15 minutes delayed. Currency and commodity quotes are all 10 minutes delayed. All others are updated irregularly.