四度空间除了能显示一般传统技术分析之价位及时间外,还增加了两项其他技术分析没有的概念――人和事。以传统技术分析和图表技术所判断的价位变动来比较,使用四度空间的理论,更能令投资者察觉到市场的潜能和力量。不过,四度空间欠缺一个简明的图表来阐述金融工具,所以要提升四度空间的概念来融入棒形图/阴阳烛图内,是一件知易难行的事。 乾坤烛发明的目的是企图减低四度空间和其他技术分析图表在功能上的限制。同时,提升成交量和时间的因素於传统的技术分析和图表内。 一般来说,乾坤烛的概念与四度空间相似,两者皆由钟形曲线理论而生。与传统图表不同,崭新及直接的乾坤烛图表提供重要和专业的市场资讯,强化你对金融工具的结构和理论之信心。 乾坤烛理论加入了时间和成交量,目的是减低在其他技术分析工具和图表上产生的限制,所以乾坤烛分为两种计算方法:以成交量计算和以时间计算。其概念将会在下文细述。 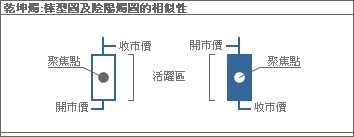  乾坤烛的外形与棒形图和阴阳烛图甚为相似,所以分析员绝不会对乾坤烛感到陌生。乾坤烛表达开高低收的方式与棒形图无异,其烛身亦跟阴阳烛非常相似,同样以白色代表低开高收;深色代表高开低收。但乾坤烛却能提供更多的重要讯息反映市场动向,以下为乾坤烛独有的数据: 乾坤烛的外形与棒形图和阴阳烛图甚为相似,所以分析员绝不会对乾坤烛感到陌生。乾坤烛表达开高低收的方式与棒形图无异,其烛身亦跟阴阳烛非常相似,同样以白色代表低开高收;深色代表高开低收。但乾坤烛却能提供更多的重要讯息反映市场动向,以下为乾坤烛独有的数据:
聚焦点――乾坤烛烛身中的圆点代表当日成交最多的价位。 有两种方法计算聚焦点: 『成交量计算法』与『时间计算法』,约98%情况下,以此两种方法计算所得之聚焦点为同一价位; 如遇特别市场活动,如批股等,则用时间计算法所得之聚焦点更能清晰反应市场行为。 以『时间法』计算出来的聚焦点: 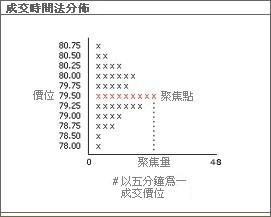
以某一交易日为例,由开市起计,每五分钟为一基数(例:10:00-10:04, 10:05-10:09, 10:10-10:14, 如此类推)。港股每日开市由上午10时至下午4时,共48个基数(即4个交易小时x 12个基数)。 所有价位都以基数记录下来,用作计算聚焦点。每一个价位的五分钟基数,无论只有1个交易或千个交易,我们都只会采用1个基数为代表(如左图的"X") 出现最多五分钟基数的价位,即为当日的聚焦点(见上图显示之红色位置)。 此计算方法用在没有成交量的外汇市场,尤为合适。此方式更能有助避开大户在短期内的大手操控和造价,以致开市及收市价大起大落。因此,乾坤烛比传统的分析工具更能有效地揭穿假突破,助你避开陷阱。 以『成交量法』计算出来的聚焦点: 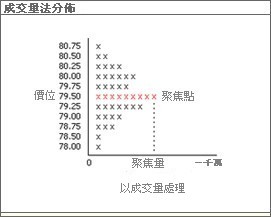 顾名思义,取自全日成交量最多的价位。只适用於附有成交量的金融产品。 顾名思义,取自全日成交量最多的价位。只适用於附有成交量的金融产品。
随着聚焦点的开发,应运而生的还有聚焦量和聚焦成交量。聚焦量是以聚焦点(时间法)相对的基数数值;而聚焦成交量是聚焦点(成交量法)相对的成交量。两者各有优胜之处,缺一不可。我们相信聚焦量和聚焦成交量可在芸芸的技术指标中,得到大家的认同。 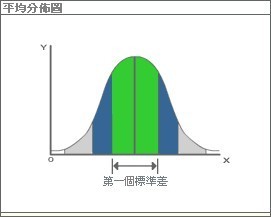 活跃区是另一个乾坤烛独有的数据。其特点与四度空间的价值区域相似,同样由统计学上的正常分布衍生出来,利用电脑计算出位於中位数正负一个标准差的价格。简单来说,活跃区代表着全日约68%的交投记录(见附图绿色位置)。 活跃区是另一个乾坤烛独有的数据。其特点与四度空间的价值区域相似,同样由统计学上的正常分布衍生出来,利用电脑计算出位於中位数正负一个标准差的价格。简单来说,活跃区代表着全日约68%的交投记录(见附图绿色位置)。
利用活跃区作分析,每一个时段内的成交分布一目了然,有效看穿假突破,逃过大户的操纵。 综合以上各点,乾坤烛并不是要取代专业人仕常用的传统技术分析和图表工具,而是提升传统技术工具(如阴阳烛、相对强弱指数、移动平均线等)的功能。 |