Nov 3, 2025  2:16:39 PM HKT

TourSiteMapFAQsAboutContact
Home QR  Forex TV 
UsernamePassword
SavePW
sp

  Home > Education > Advanced Tech Analysis > Indicators > Stochastic (STC)patentsp
  
sp
sp
sp
indicators
Stochastic (STC)
sp

The Stochastic (STC) oscillator, developed by George Lane, is a momentum indicator that compares the price of a security relative to the trading (high/low) range over a period of time. Closing levels that are consistently at the top of the range indicate accumulation of the security (buying pressure), whereas closing levels near the bottom of the range suggests distribution (selling pressure).

The Stochastic oscillator has three types: fast, slow, and full. All are, however, based on the fast Stochastic.

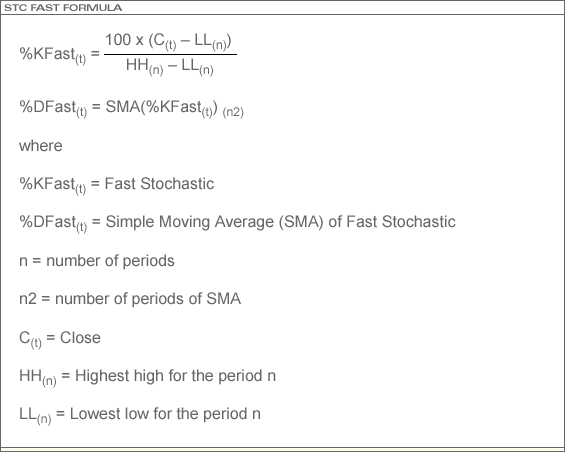
The formula for the Fast Stochastic is:

STC

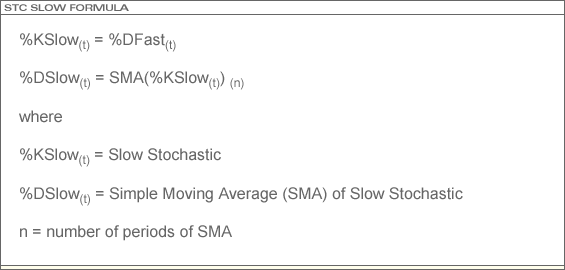
The formula for the Slow Stochastic is:

STC

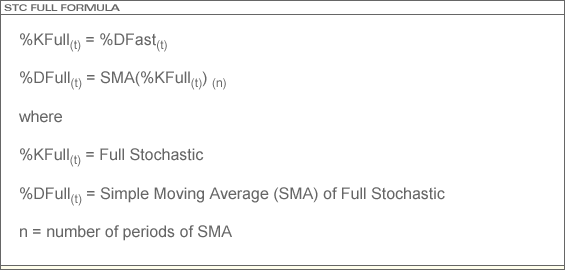
The formula for the Full Stochastic is:

STC

The Full Stochastic Oscillator takes three parameters. The first and last parameters are identical to the Fast and Slow versions. The first is the number of periods used to calculate the %K line and the last is the number of periods used to create the %D signal line. The difference is the second parameter, which is used as a smoothing factor of the %K line. With the smoothing factor, this Stochastic is thus more flexible for analysis.

The Stochastic is a lower technical study. ProSticks provides the Full Stochastic for users. Default parameters of 14, 3, and 3 bars are used to calculate the Full Stochastic. This is actually equivalent to the (14, 3) Slow Stochastic. The Exponential Moving Average (EMA) can also be applied, instead of the Simple Moving Average (SMA), to the calculation.

Note that a (14, 3) Fast Stochastic would be equivalent to a (14, 1, 3) Full Stochastic and a (14, 3) Slow Stochastic would be the same as a (14, 3, 3) Full Stochastic.

The Stochastic Oscillator is best used to detect the divergence signals it provides. Divergence occurs when the Stochastic %D line makes a set of lower highs while the security continues to make new highs. This signals an overbought market. Conversely, a series of lower lows accompanied by higher lows from the %D line signals an oversold market.

Also, when the %K line crosses the %D line from the right hand side, during tops and bottoms, and with divergence, this is a strong signal to initiate a position. A strong buy signal occurs when the %D is between 10 and 15 and a strong sell signal is when the %D is between 85 and 90.


PreviousNext
sp
sp
Contents
spAvg Directional Index (ADX)
sp
spAverage True Range (ATR)
sp
spBollinger Bands (BOL)
sp
spComm Channel Index (CCI)
sp
spFibonacci Studies
sp
spGann Lines
sp
spKeltner Channels (KC)
sp
spMomentum (MTM)
sp
spMoney Flow Index (MFI)
sp
spMoving Avg Conv Div (MACD)
sp
spMoving Avg Envelope (MAE)
sp
spMoving Avg - Exponential (EMA)
sp
spMoving Avg - Simple (SMA)
sp
spMoving Avg - Weighted (WMA)
sp
spOn Balance Volume (OBV)
sp
spParabolic Stop&Reversal (SAR)
sp
spRate of Change (ROC)
sp
spRelative Strength Index (RSI)
sp
spStochastic (STC)
sp
spVolatility (VOLA)
sp
spVolume (VOL)
sp
spVolume+ (VOLP)
sp
spVol Accumulation Osc (VAO)
sp
spWilliams %R
sp
sp

sp
agreementspprivacysppatent
sp
sp
sp
sp

Copyright© 2025 ProSticks.com Limited. All rights reserved. ProSticks.com Limited, Hong Kong Exchanges and Clearing, HSI Services Limited, endeavor to ensure the accuracy and reliability of the information provided but do not guarantee its accuracy or reliability and accept no liability (whether in tort of contract or otherwise) for any loss or damage arising from any inaccuracies or omission. Currently, all Hong Kong stock and index quotes are at least 15 minutes delayed. Currency and commodity quotes are all 10 minutes delayed. All others are updated irregularly.